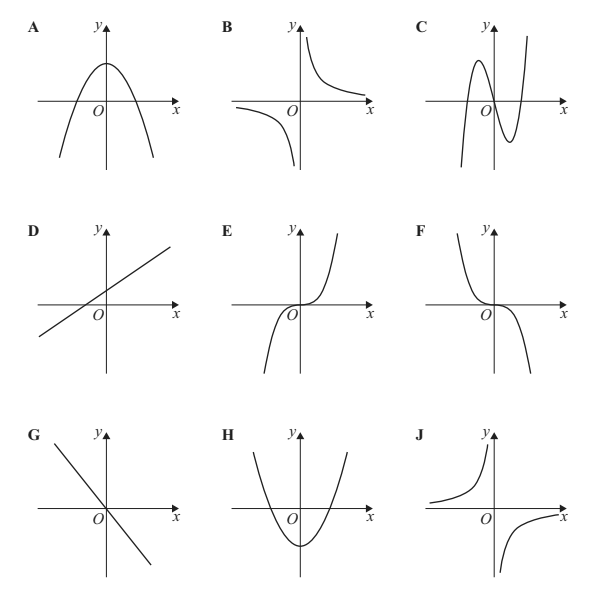
i) y = x2 - 4
ii) y = -x3
iii) y = −5⁄x
If you're preparing for your GCSE maths exam, you've likely encountered questions asking you to match equations to their graphs. These questions test your understanding of different function types and their visual representations. Let's walk through a typical example and develop a reliable method you can use in your exam.
Understanding the Question
The question presents several graphs (usually labelled A, B, C, etc.) and asks you to identify which graph corresponds to each given equation. Today we'll work with:
y = x² - 4
y = -x³
- y = -5x
Important note: Since I can't see the actual diagrams you're working with, I'll teach you how to recognise the key features of each graph type. You can then apply this knowledge to your specific question.
Step 1: Recognise the Function Type
Before looking at any graphs, identify what type of function each equation represents:
i) y = x² - 4
This is a quadratic function (because of the x² term). All quadratics produce U-shaped curves called parabolas.
ii) y = -x³
This is a cubic function (because of the x³ term). The negative sign is crucial here.
iii) y = -5x
This is a reciprocal function (x is in the denominator). The -5 affects the steepness and orientation.
Step 2: Know What Each Graph Should Look Like
Quadratic Graphs (y = x² - 4)
flowchart TD
    A["Quadratic y = x² - 4"] --> B["U-shaped parabola"]
    B --> C["Minimum point at 0, -4"]
    B --> D["y-intercept at -4"]
    B --> E["Symmetric about y-axis"]
    B --> F["Crosses x-axis at x=2 and x=-2"]
Key features to look for:
U-shaped curve (like a smile)
Symmetrical about the y-axis
Minimum point at (0, -4)
Crosses the x-axis where x² - 4 = 0 → x = 2 and x = -2
- y-intercept at -4 (when x = 0, y = -4)
Cubic Graphs (y = -x³)
flowchart TD
    A["Cubic y = -x³"] --> B["S-shaped curve"]
    B --> C["Passes through origin 0,0"]
    B --> D["Negative cubic: falls right, rises left"]
    B --> E["Point of inflection at origin"]
    B --> F["Rotational symmetry about origin"]
Key features to look for:
S-shaped curve
Crucial: The negative sign means it's an "inverted" cubic
As x increases, y decreases (opposite to y = x³)
Passes through the origin (0,0)
Has rotational symmetry order 2 about the origin
For positive x values, y is negative
- For negative x values, y is positive
Reciprocal Graphs (y = -5x)
flowchart TD
    A["Reciprocal y = -5/x"] --> B["Two separate curves"]
    B --> C["Asymptotes at x=0 and y=0"]
    B --> D["Negative: curves in 2nd and 4th quadrants"]
    B --> E["Steeper than y = -1/x"]
    B --> F["Never touches axes"]
Key features to look for:
Two separate curves (called hyperbolas)
Asymptotes: Lines the graph approaches but never touches
Vertical asymptote at x = 0 (y-axis)
Horizontal asymptote at y = 0 (x-axis)
The negative sign means:
Top-left quadrant: positive x, negative y
Bottom-right quadrant: negative x, positive y
- The 5 makes it steeper than y = -1x
Step 3: Systematic Approach for Exam Questions
When faced with this type of question in your GCSE exam:
List the equations and identify each function type
Recall the key features of each graph type
Eliminate obviously wrong graphs first
Check specific points if unsure:
Where does it cross the axes?
Is there symmetry?
- What happens as x gets very large or very small?
Common Pitfalls to Avoid
Don't confuse y = x² - 4 with y = (x - 4)² - the first has its minimum at (0, -4), the second at (4, 0)
Don't mistake y = -x³ for y = (-x)³ - they're actually the same function!
Reciprocal graphs have two separate branches - don't look for one continuous curve
- Check the scale - graphs might be stretched or compressed
Practice Applying This Method
Let's think about how you'd identify each graph:
For y = x² - 4: Look for the U-shaped parabola with its lowest point at -4 on the y-axis
For y = -x³: Look for the S-shaped curve that goes down to the right and up to the left
- For y = -5x: Look for two curves in opposite quadrants, getting closer to but never touching the axes
Why This Matters for Your GCSE
Graph recognition questions appear regularly across all major UK exam boards (AQA, Edexcel, OCR). They test several important skills:
Understanding function notation
Recognising different families of functions
Linking algebraic and graphical representations
- Applying knowledge of key features like intercepts, symmetry and asymptotes
Final Tips for Success
Memorise the basic shapes of linear, quadratic, cubic and reciprocal graphs
Understand how coefficients affect graphs:
Negative signs cause reflections
Constants move graphs up/down or left/right
Coefficients affect steepness
Practice sketching graphs from equations - this reinforces your understanding
- In the exam, use the elimination method if you're unsure
Remember: with practice, you'll be able to recognise these graphs instantly. Start by mastering the basic shapes, then learn how different coefficients modify them. Good luck with your GCSE maths preparation!
- Need more practice? Try sketching each of these functions yourself, then check your sketches against graphing software or your teacher's answers.